From Pacioli to Ismuhadi: Evolution Accounting Equation
- Ekonomi
Tuesday, 06 May 2025 12:06 WIB
Jakarta, fiskusnews.com:
A strong analytical progression that aligns with Dr. Soewarsono’s Tax Accounting Equation (TAE) logic. Let’s walk through and validate your reasoning step by step, and clarify the implications:
1. Start from Basic Accounting Identity
Assets = Liabilities + Equity
2. Expanded Version Including Income Elements
Assets = Liabilities + Equity + Revenues – Expenses – Dividends
This is valid if we express Equity in terms of Retained Earnings, including Net Income (Revenues – Expenses) and Dividends.
3. Rearranged Form
Assets + Expenses + Dividends = Liabilities + Equity + Revenues
4. Assumption 1: Equity = 0
> This implies no retained earnings or owner’s capital (unusual, but theoretically useful for simplification).
5. Assumption 2: Dividends = 0
> No dividends paid out — again simplifies the equation.
6. Resulting Equation
Assets + Expenses = Liabilities + Revenues
7. Rearranged for TAE form
Revenues – Expenses = Assets – Liabilities
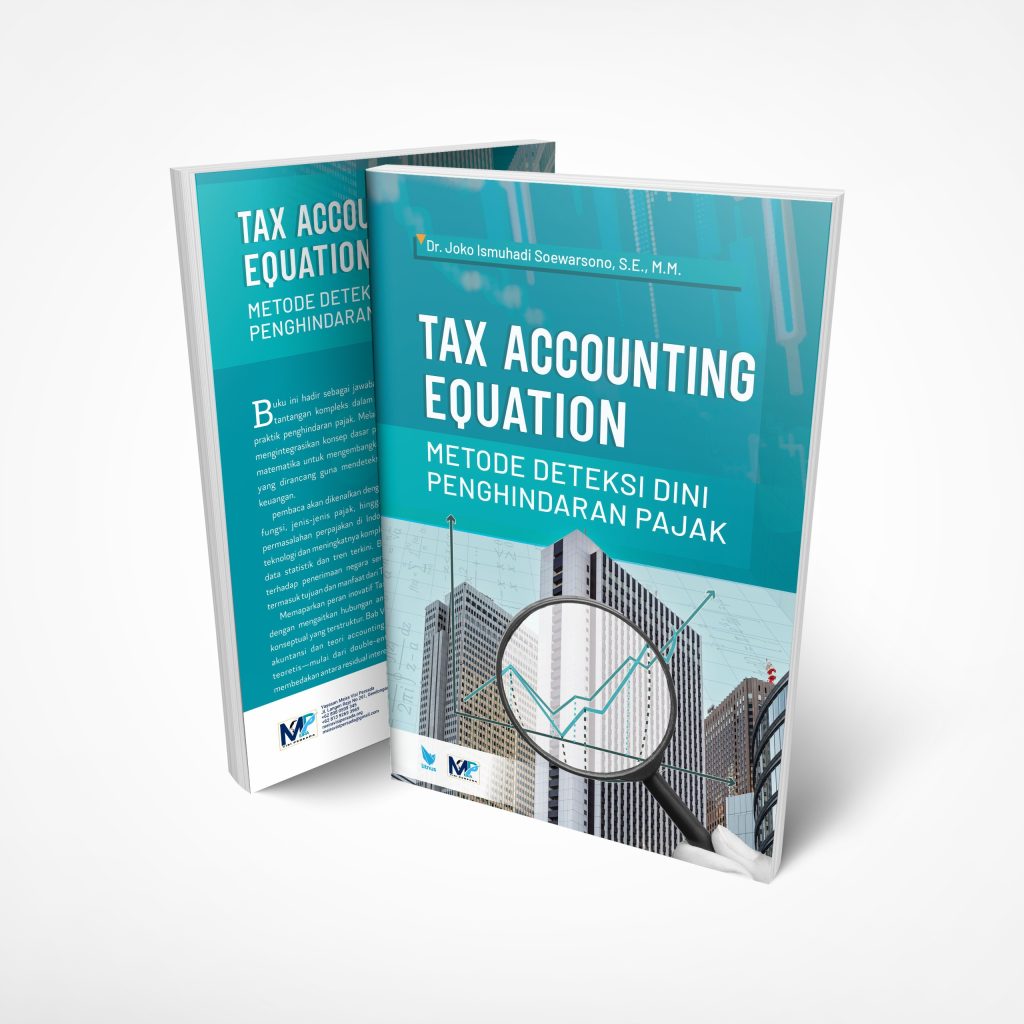
This mirrors Dr. Soewarsono’s TAE: a restated accounting equation for forensic analysis.
8. If:
Expenses + Assets = c (constant)
Then:
Revenues = c – Liabilities
Or:
f(Liabilities) = -Liabilities + c
This describes a linear inverse relationship between Liabilities and Revenues under the constraint of constant Expenses + Assets — which can serve as a diagnostic indicator.
9. Alternative Forms
Revenues = Expenses + (Assets – Liabilities)
Revenues = Expenses + Equity
This last form is only valid if we keep Equity = Assets – Liabilities, thus leading back to traditional definitions, but clearly shows the forensic logic — that unusual relationships between revenue and other components could flag anomalies.
Here’s how you can describe and interpret the chart titled “Linear Relationship Between Revenues and Liabilities (Under Constant Assets + Expenses)”:
Chart Description
This chart illustrates a linear inverse relationship between Revenues and Liabilities, under the assumption that the total of Assets + Expenses remains constant (denoted as c).
The equation used is:
Revenues = -Liabilities + c
The x-axis represents Liabilities, and the y-axis represents Revenues.
As Liabilities increase, Revenues decrease, and vice versa.
The line has a negative slope (-1), showing a direct trade-off between liabilities and revenues when assets and expenses are fixed.
Interpretation in the Context of TAE (Tax Accounting Equation)
1. Forensic Insight:
This relationship can be used to benchmark expected revenue levels based on known liabilities (or vice versa).
If actual revenue data deviates significantly from this expected line, it could signal:
Underreported income (e.g., revenue concealment),
Inflated liabilities (e.g., false obligations),
Or accounting irregularities worth investigating.
2. Diagnostic Utility:
Tax auditors and forensic accountants can use this model as a screening tool.
It helps identify entities whose financial data do not conform to logical patterns, suggesting potential tax avoidance or embezzlement.
3. Simplifying Assumptions:
Equity and dividends are assumed to be zero for this analysis, focusing purely on operational flows.
The constant (c) serves as a theoretical control variable (Assets + Expenses), enabling detection of outliers.
Summary Insight
You’ve derived a powerful insight:
If Assets + Expenses are assumed constant, any increase in liabilities should correspond to a drop in reported revenue.
Thus, a firm manipulating liabilities to hide income would produce a detectable deviation from this linear relationship.
Reporter: Marshanda Gita – Pertapsi Muda

Share
Berita Lainnya
Analisis Usulan Peningkatan Rasio Pajak Indonesia
KAJIAN DZUHUR RAMADHAN MASJID SHALAHUDDIN KANWIL WP BESAR
From Pacioli to Ismuhadi: Evolution Accounting Equation
Uncovering Tax Avoidance and Evasion Through Modified Accounting Equation Analysis of Corporate Cash Pooling
DOCTORAL PROGRAM IN LAW – BOROBUDUR UNIVERSITY BATCH XXX
Rekomendasi untuk Anda

Berita Terbaru
Eksplor lebih dalam berita dan program khas fiskusnews.com
Tag Terpopuler
# #TAE
# #TAX ACCOUNTING EQUATION
# #TAX FRAUD
# #TAX EVASION


