Analysis of Accounting Equations, Underground Economy, Crude Palm Oil Markets, and Forex Hedging
- Ekonomi
Sunday, 04 May 2025 00:16 WIB
Jakarta, fiskusnews.com:
1. Introduction
This report provides a detailed analysis addressing several distinct areas of inquiry: the potential of specific and general tax accounting equations to reveal underground economic activity, the global dynamics of crude palm oil production and consumption, and the interplay between cash management services, bank overdrafts, foreign exchange transactions, and hedging strategies. Each of these topics presents its own complexities, requiring a thorough examination of available data and established economic principles to provide a comprehensive understanding.
2. The Role of Accounting Equations in Uncovering Underground Economic Activity
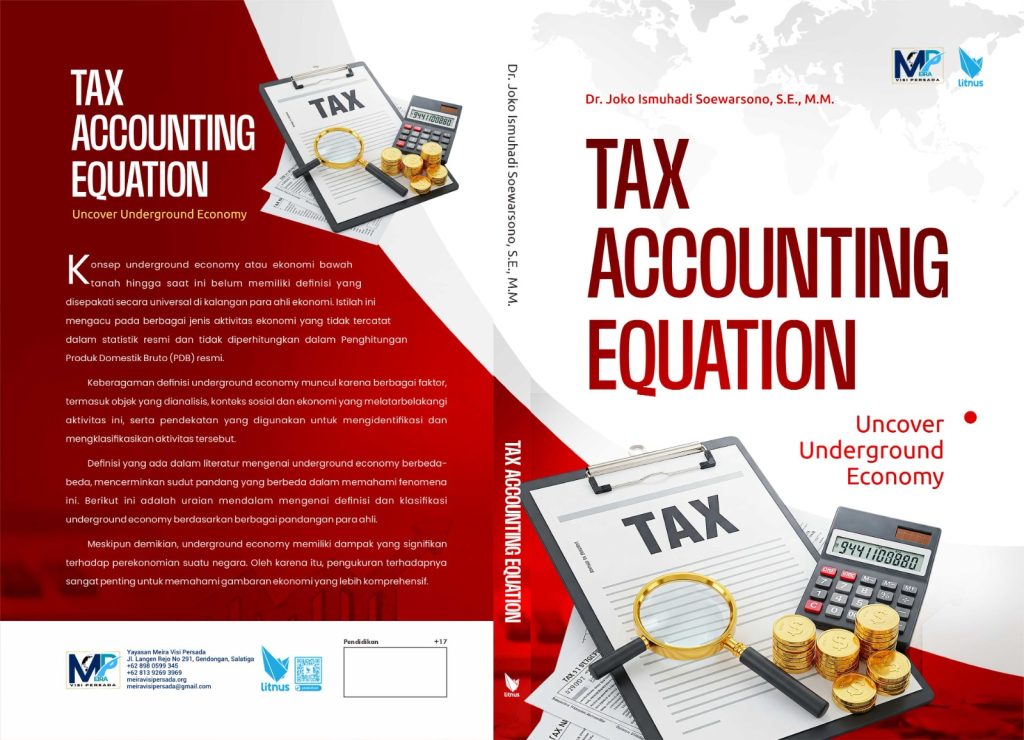
2.1. Examining “Ismuhadi’s Equation” Dr. Joko Ismuhadi Soewarsono, an Indonesian Senior Tax Auditor, has contributed significantly to the field of tax accounting through the development of the “Tax Accounting Equation (TAE)” and the “Mathematical Accounting Equation (MAE)”. Given Dr. Ismuhadi’s professional role, it is reasonable to infer that these equations are primarily designed with the Indonesian tax framework in mind. The core objective of both the TAE and MAE is to serve as early detection tools for tax avoidance and evasion committed by corporate taxpayers. One notable variation, the Modified Accounting Equation (Revenue = Expenses + Assets – Liabilities), while departing from conventional accounting formats, offers a unique perspective for scrutinizing potential fraudulent activities. This rearrangement allows for an examination of the alignment between a company’s operational performance, as reflected in its revenue and expenses, and its financial position, represented by its assets and liabilities. If reported expenses, asset accumulation, and liability settlements do not correspond with expected revenue levels based on industry standards or a company’s historical performance, it could indicate potential irregularities. The Mathematical Accounting Equation (MAE), expressed as Asset = Liability + Equity + {(Revenues – Expenses) – Dividend}, further expands upon the standard accounting equation by explicitly incorporating elements from the income statement and cash flow statement. This expanded form aims to assess the correlation between a company’s reported profits, changes in equity through retained earnings, and the declaration of dividends. The rationale behind this approach is to determine whether corporate taxpayers are making a significant contribution to corporate income tax by ensuring consistency between reported financial performance and balance sheet changes. Dr. Ismuhadi also suggests that companies might strategically misclassify actual revenue as liabilities to understate their taxable income. This tactic, if employed, would directly impact the relationships within the accounting equation, potentially making it detectable through careful analysis using Ismuhadi’s proposed equations.
2.2. General Tax Accounting Equations The foundational Tax Accounting Equation, Assets = Liabilities + Equity, serves as a fundamental principle in evaluating a company’s financial statements. This equation establishes the essential balance between a company’s resources (assets) and the claims against those resources by creditors (liabilities) and owners (equity). Tax accounting, in its broader scope, is primarily concerned with the reporting of financial information in accordance with tax laws and regulations, ensuring that companies fulfill their tax obligations. While these standard accounting equations are crucial for maintaining financial equilibrium and reporting for tax purposes, their ability to directly uncover underground economy activity is inherently limited. Activities within the underground economy are intentionally concealed to evade taxes, regulations, or legal restrictions, and as such, are not typically recorded in standard accounting systems or tax filings.
2.3. Potential for Indirect Indicators and Econometric Models While direct detection through simple accounting equations is unlikely, sophisticated econometric models that analyze macroeconomic data can provide indirect estimates of the size and trends within the underground economy. These models may incorporate tax revenue, currency in circulation, and discrepancies between income and expenditure as variables in their analysis. The tax multiplier, which illustrates the ratio between a change in national income and a change in tax , offers an example of an economic concept that, while not directly revealing underground activity, can provide indirect clues. Significant deviations between anticipated tax revenue changes based on the multiplier and actual revenue collected could suggest the presence of a substantial portion of economic activity that is not being captured within the formal tax system. It is important to distinguish these complex econometric models from simpler equations like Ismuhadi’s or the standard tax accounting equation. The former utilizes tax data as one component among many to estimate the overall size of the hidden economy, whereas the latter focuses on the financial reporting consistency of individual entities within the formal economic framework.
3. Methods for Estimating the Size and Scope of the Underground Economy
3.1. Econometric Approaches
3.1.1. Currency Demand Approach (CDA) The Currency Demand Approach operates on the fundamental assumption that transactions within the underground economy are predominantly conducted using cash to avoid detection by tax authorities. This method estimates the size of the hidden economy by analyzing the “excess sensitivity” of real currency holdings to average tax rates. The core idea is that higher tax burdens incentivize individuals and businesses to engage in cash-based transactions in the underground economy, leading to an increased demand for currency. Pioneering work by Tanzi in the 1980s laid the foundation for this approach. The econometric modeling often involves estimating a demand function for currency, incorporating variables such as disposable income, interest rates, inflation, financial innovations, and the average tax rate. Error correction models are frequently employed to account for both short-run dynamics and long-run equilibrium relationships between these variables. However, the CDA is subject to several limitations. Not all transactions in the shadow economy are necessarily conducted in cash. Isolating the impact of the tax burden from other factors influencing currency demand, such as general “tax morality” or advancements in financial technology, can be challenging. Furthermore, this approach typically assumes that the velocity of money (the rate at which money changes hands) is the same in both the formal and informal economies, which may not hold true.
3.1.2. MIMIC (Multiple Indicators Multiple Causes) Model The MIMIC model represents a more complex econometric approach that treats the underground economy as a latent, unobservable variable. This latent variable is assumed to be influenced by several observable “causes” and to manifest itself through various observable “indicators”. The model comprises two main sets of equations: a measurement equation that links the indicator variables (such as observed GDP and currency holdings) to the latent underground economy variable, and a structural equation that specifies the causal relationships between factors like tax burdens, unemployment rates, and government regulations, and the latent variable. Early applications of the MIMIC model in this context include the work of Frey and Weck-Hannemann in 1984 and Aigner, Schneider, and Ghosh in 1988, with more recent contributions from Giles and Tedds in 2002. Despite its sophistication, the MIMIC model faces several criticisms. The selection of causal and indicator variables can be subjective and may lack a strong theoretical basis. The results can be sensitive to data transformations and the units of measurement used. Additionally, the fundamental assumption that the underground economy can be adequately represented by a single latent variable with specific relationships to its causes and indicators has been questioned.
3.2. Discrepancy Methods
3.2.1. Discrepancy between National Expenditure and Income Statistics This method is predicated on the theoretical principle that the total value of goods and services produced in an economy should be equal whether measured from the income side or the expenditure side. The underlying idea is that activities in the informal economy might be more readily captured in expenditure statistics (due to some level of self-reporting in consumption surveys) compared to income statistics, which often rely on data from registered firms in the formal sector. Consequently, the difference between these two measures can serve as a potential indicator of the size of the shadow economy. However, this approach has limitations. National statistical agencies typically aim to minimize this discrepancy in their published figures, potentially through adjustments that might obscure the true extent of the informal economy. Furthermore, the difference between income and expenditure measures can arise due to sampling errors, statistical errors, and other factors unrelated to informal economic activity.
3.2.2. Discrepancy between Official and Actual Labor Force This method operates on the assumption that if the total labor force participation rate remains relatively constant, a decrease in the participation rate in the official, recorded economy could suggest a corresponding increase in activity within the informal economy. The logic is that individuals who are no longer participating in the formal labor market might be engaged in undeclared work in the hidden sector. However, changes in official labor force participation can be attributed to various factors other than a shift towards the informal economy, such as individuals leaving the workforce due to retirement, pursuing further education, or becoming discouraged during economic recessions. Additionally, many individuals might participate in both the formal and informal economies simultaneously, making this a less precise indicator.
3.3. Direct Methods
3.3.1. Sample Surveys Direct methods for estimating the underground economy involve directly engaging with individuals and businesses. Sample surveys entail administering questionnaires to a selected group of individuals to gather information about their potential involvement in unreported economic activities. While surveys can provide detailed insights into the structure and nature of the hidden economy, a significant drawback is the potential for underreporting. Individuals engaged in illegal activities or tax evasion are often hesitant to disclose such information, even in anonymous surveys. The accuracy of survey-based estimates heavily relies on the honesty and willingness of respondents to provide truthful answers.
3.3.2. Tax Audits Tax audits represent another direct method, where tax authorities examine the financial records of individuals and businesses to identify instances of undeclared income and other forms of non-compliance. While tax audits can directly uncover instances of tax evasion that might be linked to underground economic activity, they typically provide a lower-bound estimate of the total size. Tax audits are often targeted towards individuals or entities suspected of non-compliance and may not be representative of the entire population. Furthermore, even when audited, individuals and businesses might still conceal information from tax authorities. Tax audits primarily capture the portion of informal activities that the authorities are successful in discovering.
3.4. The Role of National Statistical Agencies National statistical agencies play a crucial role in estimating the size of the underground economy, often employing a combination of the methods discussed above. For instance, some agencies utilize “Family Budgets Investigations (FBI)” and “Integrated Households Surveys (IHS)” to gather data on income and expenditure, which can then be analyzed for discrepancies indicative of hidden economic activity. It is important to recognize that each estimation method has its own set of strengths and weaknesses, and the selection of the most appropriate method depends on the specific definition of the underground economy being used, the availability of reliable data, and the research objectives.
4. The Use of Tax Data in Identifying Potential Underground Economic Activity
4.1. Tax Compliance Analysis Tax authorities routinely analyze tax filings to identify potential underground economic activity through various techniques of tax compliance analysis. This involves scrutinizing tax returns for anomalies, inconsistencies, and deviations from expected patterns that might signal tax evasion, which is often a key characteristic of the underground economy. Data mining techniques are increasingly employed to discover previously unknown correlations within tax data that can predict compliance risk. By analyzing historical data on tax returns and audit outcomes, these techniques can identify patterns and characteristics associated with non-compliance, thereby improving the accuracy of detection. Trend analysis also plays a vital role in identifying emerging patterns of potential non-compliance by tracking how certain reporting behaviors or claims change over time.
4.2. Data Matching Techniques A critical tool used by tax authorities is data matching, which involves comparing taxpayer-submitted information with data obtained from a wide range of external sources. These sources can include financial institutions (providing data on bank accounts and interest earned), other government agencies (sharing information on social security, vehicle registration, and property records), and even private sector entities (such as payment processors and online marketplaces). By cross-referencing these diverse datasets, tax authorities can identify inconsistencies and discrepancies that might indicate undeclared income or other forms of non-compliance. For example, a taxpayer reporting a low income but owning luxury assets, or a business reporting low sales despite significant transaction volumes through payment processors, could be flagged for further investigation.
4.3. Limitations of Tax Data Despite the advancements in tax data analysis and matching, there are inherent limitations in their ability to fully uncover underground economic activity. The fundamental challenge is that activities within the underground economy are deliberately concealed from tax authorities. Individuals and businesses operating in this sector often take significant measures to avoid leaving a paper trail or providing accurate information in their tax filings. Common tactics include receiving payments exclusively in cash, providing false identification information such as social security numbers, and simply underreporting income. Furthermore, as noted, national income data, which forms the basis for many top-down tax gap estimations, may not provide a complete measure of the direct tax base, and macroeconomic models often provide only aggregate information without detailed breakdowns. This lack of granular data can make it difficult to pinpoint specific instances of underground activity.
5. Global Crude Palm Oil: Production, Consumption, and Trade
5.1. Current Trends in Global Production (2023-2025) Global crude palm oil production has shown a general upward trend over the period of 2023 to 2025. Estimates from various sources indicate a production volume of approximately 75.95 million metric tons for the market year 2023/2024, increasing to around 78.23 million metric tons for 2024/2025. Another report indicates a global production of 76.3 million tonnes in 2024 , while data updated in April 2025 shows 78,229 thousand metric tons for the year 2024. This consistent increase reflects the growing global demand for vegetable oils. The top producing countries in the market year 2024/2025 are projected to be Indonesia, accounting for 59% of global production with 46 million metric tons, followed by Malaysia with 24% (18.7 million metric tons), Thailand at 4% (3.4 million metric tons), Colombia at 2% (1.9 million metric tons), and Nigeria also at 2% (1.5 million metric tons). Over the decade leading up to this period (MY 2015-2024), the average global production was 71.95 million metric tons, with a compound average growth rate of 3%. Table 1: Top Global Crude Palm Oil Producing Countries (2024/2025)
Country
Percentage of Global Production
Total Production (Metric Tons)
Indonesia
59%
46,000,000
Malaysia
24%
18,700,000
Thailand
4%
3,400,000
Colombia
2%
1,900,000
Nigeria
2%
1,500,000
Guatemala
1%
990,000
Papua New Guinea
1%
830,000
Brazil
0.77%
600,000
Cote d’Ivoire
0.77%
600,000
*Source: [27, 29]*
5.2. Global Consumption Patterns Global consumption of crude palm oil has also been on the rise. Forecasts for 2023-2024 indicate a growth of 4.76% to reach 78.06 million tonnes. Data for 2024 suggests a global consumption of 83 million tons, representing a 2% increase from 2023. Another report estimates the global consumption for 2024 at 75.1 million tonnes. Major consuming countries include India, China, Indonesia, and the European Union. Notably, Indonesia itself was the largest consumer in 2024, with an estimated consumption of 46 million tons, followed by Malaysia at 15 million tons and India at 7.3 million tons. In 2018/2019, India, the European Union, and China were the largest importers, primarily for use in cooking.
5.3. International Trade The international trade of crude palm oil is dominated by a few key players. Indonesia and Malaysia are the largest exporting countries, together accounting for approximately 90% of global palm oil exports. In 2021, Indonesia exported 25.5 million metric tons, while Malaysia exported 13.5 million metric tons, and Guatemala exported 0.8 million metric tons. Other exporting countries include Thailand and Colombia. On the importing side, India, China, and the European Union are consistently the largest importers. In 2021, India imported around 8.2 million metric tons, China 6.4 million metric tons, and the EU 6 million metric tons. Pakistan is also a significant importer. Table 2: Major Importing and Exporting Countries of Crude Palm Oil (2021)
Country
Import Volume (Million Metric Tons)
Export Volume (Million Metric Tons)
India
8.2
–
China
6.4
–
European Union
6.0
–
Indonesia
–
25.5
Malaysia
–
13.5
Guatemala
–
0.8
*Source: [34]*
6. Detailed Analysis of Crude Palm Oil Usage
6.1. Food Industry The food industry represents the largest single application for crude palm oil, consuming a significant majority of global production, estimated between 66% and 85%. Its versatility and cost-effectiveness make it a preferred ingredient in a wide array of food products. Specific product categories that utilize crude palm oil include cooking oils and frying fats, margarine and shortening, baked goods such as biscuits, cakes, pastries, and bread, confectionery items like chocolate and candies, and various processed foods including ice cream, non-dairy creamer, salad dressing, alternatives to cheese, condiments, instant noodles, and pizza dough. Palm oil is also used in animal feed. In Indonesia, for example, palm oil consumption in the food sector is projected to rise to 6.9 million metric tons for the market year 2023/24. Table 3: Examples of Crude Palm Oil Usage in the Food Industry by Product Category
6.2. Oleochemical Industry Crude palm oil serves as a crucial raw material for the oleochemical industry, which transforms it into various chemical compounds such as fatty acids, glycerin, fatty alcohols, and biodiesel. These oleochemical derivatives are then utilized in the production of a wide range of end products. Fatty acids are used in the manufacturing of soaps, detergents, cosmetics, and candles. Glycerin finds applications in personal care products, pharmaceuticals (including cough syrups and oral care products), and the food industry. Fatty alcohols are key ingredients in detergents, surfactants, and cosmetics. Biodiesel is produced from palm oil as a renewable fuel source. Other oleochemicals derived from palm oil include fatty methyl esters used in pharmaceuticals, cosmetics, plastics, and textiles, as well as fatty amines used in the mining industry and road building, and polyurethane used in insulating materials. Palm oil derivatives also function as emulsifiers in food, cosmetics, and pharmaceuticals, and are used to produce industrial lubricants and surfactants found in cleaning products and personal care items. The oleochemical market is witnessing increasing demand for renewable and sustainable materials, positioning palm oil-based oleochemicals as environmentally friendly alternatives to petrochemicals. Table 4: Applications of Crude Palm Oil in the Oleochemical Industry and Examples of End Products
Oleochemical Derivative
Examples of End Products
Fatty Acids
Soaps, Detergents, Cosmetics, Candles
Glycerin
Personal Care Products, Pharmaceuticals (Cough Syrups, Oral Care), Food Industry
Fatty Alcohols
Detergents, Surfactants, Cosmetics
Biodiesel
Renewable Fuel Source
Fatty Methyl Esters
Pharmaceuticals, Cosmetics, Plastics, Textiles
Fatty Amines
Mining Industry (Anti-caking Agent), Road Building
Polyurethane
Insulating Materials
Emulsifiers
Food, Cosmetics, Pharmaceuticals
Lubricants
Industrial Lubricants
Surfactants
Cleaning Products, Personal Care Items
*Source: [43, 44, 45, 46, 47, 48, 49, 52]*
6.3. Other Industrial Uses Beyond its prominent roles in the food and oleochemical industries, crude palm oil and its derivatives find applications in various other industrial sectors. These include the production of lubricants and grease for industrial machinery. Vegetable oil-based derivatives, including those from palm oil, are utilized in the manufacturing of certain plastics and polymers. In the agrochemical sector, palm oil-based materials are used to develop crop protection products such as insecticides. The paint and surface coatings industry utilizes bio-solvents, alkyl resins, and varnishes derived from vegetable oils like palm oil. Palm oil is also used in the production of printing inks. Resins and methyl esters derived from palm oil have various industrial applications. Palm wax, a derivative of palm oil, is used in candle making. Glycerine, an oleochemical from palm oil, is used in the pharmaceutical industry, including in cough syrups and oral care products. The moisturizing properties of palm oil make it suitable for use in cosmetics. Furthermore, crude palm oil can be directly used as a biofuel for electricity generation and in vehicles fitted with specific engines.
7. Understanding Bank Overdrafts, Forex Transactions, and Hedging Activity
7.1. Cash Management Services and Bank Overdrafts Cash management services provided by banks are designed to assist businesses in efficiently managing their cash flow. A bank overdraft occurs when a business spends more money than is available in its account, resulting in a negative balance and representing a short-term form of borrowing. Bank overdraft facilities within cash management services serve several primary purposes for businesses. They provide immediate access to funds to cover unexpected expenses or temporary dips in cash flow, allowing businesses to manage their working capital more effectively. Overdrafts can offer a quicker and simpler way to access funds compared to traditional loan application processes, and they often function as a revolving line of credit, enabling businesses to borrow and repay funds as needed within a set limit. Furthermore, overdraft protection services can help businesses avoid the fees and penalties associated with bounced checks or declined transactions due to insufficient funds. The mechanics of overdraft facilities typically involve linking the business checking account to another account, such as a savings account, money market account, credit card, or a dedicated line of credit. When an overdraft occurs, funds are automatically transferred from the linked account to cover the negative balance, often in predetermined increments. These transfers may be subject to fees, and the overdrawn amount typically incurs interest charges, which can be higher than those for other forms of business borrowing. The availability and limit of an overdraft facility are usually determined based on the business’s creditworthiness and its relationship with the bank.
7.2. Forex Transactions and Hedging A foreign exchange (forex) transaction involves the buying and selling of one currency in exchange for another. Hedging activity, in the context of forex, is a risk management strategy employed to mitigate the potential for financial losses resulting from adverse fluctuations in exchange rates. Businesses engaged in international trade or investment often face exposure to currency risk, as the value of foreign currency payments or receipts can change over time due to exchange rate volatility. To protect themselves from these risks, companies may implement forex hedging strategies.
7.3. The Distinction: Bank Overdraft vs. Forex Hedging It is crucial to understand that a bank overdraft is not a typical or direct instrument for hedging foreign exchange risk. While both involve financial transactions, they serve fundamentally different purposes. A bank overdraft is primarily a tool for short-term borrowing to address immediate cash flow needs. It incurs interest costs and provides temporary liquidity but does not inherently offer protection against currency fluctuations. In contrast, forex hedging involves the use of specific financial instruments designed to offset potential losses arising from exchange rate movements. Common forex hedging instruments include forward contracts, which lock in a specific exchange rate for a future transaction ; currency options, which provide the right, but not the obligation, to buy or sell a currency at a specified rate within a certain timeframe ; and currency swaps, which involve exchanging principal and/or interest payments in one currency for those in another at a predetermined rate. While it is theoretically possible for a company to utilize an overdraft to fund a separate forex hedging transaction, such as using the borrowed funds to purchase a forward contract in a foreign currency, this would constitute two distinct and independent financial activities. The bank overdraft itself would remain a borrowing mechanism and not the hedging activity.
8. Conclusion
In conclusion, while accounting equations, including those proposed by Dr. Ismuhadi, are valuable tools for analyzing financial reporting and detecting potential tax avoidance within the formal economy, they are not designed to directly uncover the inherently hidden activities of the underground economy. Estimating the size and scope of this hidden sector requires the application of various macroeconomic models and indirect indicators. The global crude palm oil market demonstrates a consistent trend of increasing production and consumption, with Indonesia and Malaysia dominating the production landscape and India and China being major consumers. Crude palm oil finds extensive use in the food industry across numerous product categories, as well as serving as a key raw material for the oleochemical industry and having various other industrial applications. Finally, bank overdrafts are short-term borrowing facilities used in cash management services to address liquidity needs, and they are distinct from forex hedging instruments, which are specifically designed to mitigate the risks associated with currency fluctuations. An overdraft is not a typical or direct method for hedging against foreign exchange risk.

")
")